
| 일 | 월 | 화 | 수 | 목 | 금 | 토 |
|---|---|---|---|---|---|---|
| 1 | 2 | 3 | 4 | |||
| 5 | 6 | 7 | 8 | 9 | 10 | 11 |
| 12 | 13 | 14 | 15 | 16 | 17 | 18 |
| 19 | 20 | 21 | 22 | 23 | 24 | 25 |
| 26 | 27 | 28 | 29 | 30 | 31 |
Tags
- 청주시 지하철
- 픽업트럭
- 중고노트북
- 전동전기톱
- 인공지능
- 청주시 일반계 고등학교
- 가칭 동남고등학교
- 남자육아휴직
- 40대아빠육아
- 샤오미
- 감나무전지
- 준연동형비례대표
- 자전거
- 저출산
- MTB
- 아빠육아
- 대한민국선거
- 국민을 위한 국민연금은 없다
- 데이터시각화
- 파리브레스트파리
- 2024년 합계출산율
- 액티언스포츠
- 코란도스포츠
- 육아휴직급여
- 엔진오일
- 미지아
- 도로패임
- 싸이클
- 오프로드
- 콜로라도
Archives
- Today
- Total
열심히 일한 당신 떠나라
2024년 인구동향(출생, 사망, 결혼) 예측(모델: 선형회귀) 본문
데이터:
소스코드: https://colab.research.google.com/drive/1ALnsgnrGU71X8oyCZ2DELZ4odFhksk1O?usp=sharing
Untitled14.ipynb
Colab notebook
colab.research.google.com
import pandas as pd

# Load the provided Excel file to check its contents and structure
file_path = '/content/월별인구동향(최근5년).xlsx'
data = pd.read_excel(file_path)
data.head()

# Remove the extra characters from the '시점' column and convert to datetime again
data['시점'] = data['시점'].str.replace(' p)', '', regex=False)
data['시점'] = pd.to_datetime(data['시점'], format='%Y.%m')

# Check the cleaned '시점' data
data['시점'].head()

import matplotlib.pyplot as plt

# Extract year and month from the cleaned datetime
data['Year'] = data['시점'].dt.year
data['Month'] = data['시점'].dt.month

# Recreate the pivot tables
births_pivot = data.pivot_table(values='출생아수(명)', index='Year', columns='Month', aggfunc='sum')
deaths_pivot = data.pivot_table(values='사망자수(명)', index='Year', columns='Month', aggfunc='sum')
marriages_pivot = data.pivot_table(values='혼인건수(건)', index='Year', columns='Month', aggfunc='sum')

# Create visualizations
fig, axs = plt.subplots(3, 1, figsize=(14, 24), sharex=True)

# Plotting
births_pivot.T.plot(ax=axs[0], title='Monthly Births from 2020 to 2024', marker='o')
axs[0].set_ylabel('Number of Births')

deaths_pivot.T.plot(ax=axs[1], title='Monthly Deaths from 2020 to 2024', marker='o')
axs[1].set_ylabel('Number of Deaths')

marriages_pivot.T.plot(ax=axs[2], title='Monthly Marriages from 2020 to 2024', marker='o')
axs[2].set_ylabel('Number of Marriages')

plt.xlabel('Month')
plt.xticks(range(1, 13), ['Jan', 'Feb', 'Mar', 'Apr', 'May', 'Jun', 'Jul', 'Aug', 'Sep', 'Oct', 'Nov', 'Dec'])
plt.tight_layout()
plt.show()

from sklearn.linear_model import LinearRegression
import numpy as np

# Initialize the linear regression model
model = LinearRegression()

# Function to predict data
def predict_future(data_pivot):
    future_values = {}
    for month in range(1, 13):
        # Extract the month data across years
        month_data = data_pivot.loc[:, month].dropna()
        X = month_data.index.values.reshape(-1, 1)  # Year
        y = month_data.values  # Values for the month

        # Fit the model
        model.fit(X, y)

        # Predict for 2024
        future_value = model.predict(np.array([[2024]]))
        future_values[month] = future_value[0]

    return future_values

# Predict the 2024 values for each category
predicted_births = predict_future(births_pivot)
predicted_deaths = predict_future(deaths_pivot)
predicted_marriages = predict_future(marriages_pivot)

# Create DataFrames for visualization
df_predicted_births = pd.DataFrame(predicted_births, index=[2024])
df_predicted_deaths = pd.DataFrame(predicted_deaths, index=[2024])
df_predicted_marriages = pd.DataFrame(predicted_marriages, index=[2024])

# Plot the predicted 2024 data alongside historical data
fig, axs = plt.subplots(3, 1, figsize=(14, 24), sharex=True)

# Births
births_pivot.T.plot(ax=axs[0], title='Births Prediction for 2024', marker='o', legend=False)
df_predicted_births.T.plot(ax=axs[0], style='rx--', legend=False)
axs[0].set_ylabel('Number of Births')

# Deaths
deaths_pivot.T.plot(ax=axs[1], title='Deaths Prediction for 2024', marker='o', legend=False)
df_predicted_deaths.T.plot(ax=axs[1], style='rx--', legend=False)
axs[1].set_ylabel('Number of Deaths')

# Marriages
marriages_pivot.T.plot(ax=axs[2], title='Marriages Prediction for 2024', marker='o', legend=False)
df_predicted_marriages.T.plot(ax=axs[2], style='rx--', legend=False)
axs[2].set_ylabel('Number of Marriages')

plt.xlabel('Month')
plt.xticks(range(1, 13), ['Jan', 'Feb', 'Mar', 'Apr', 'May', 'Jun', 'Jul', 'Aug', 'Sep', 'Oct', 'Nov', 'Dec'])
plt.legend(['Historical Data', 'Predicted 2024'])
plt.tight_layout()
plt.show()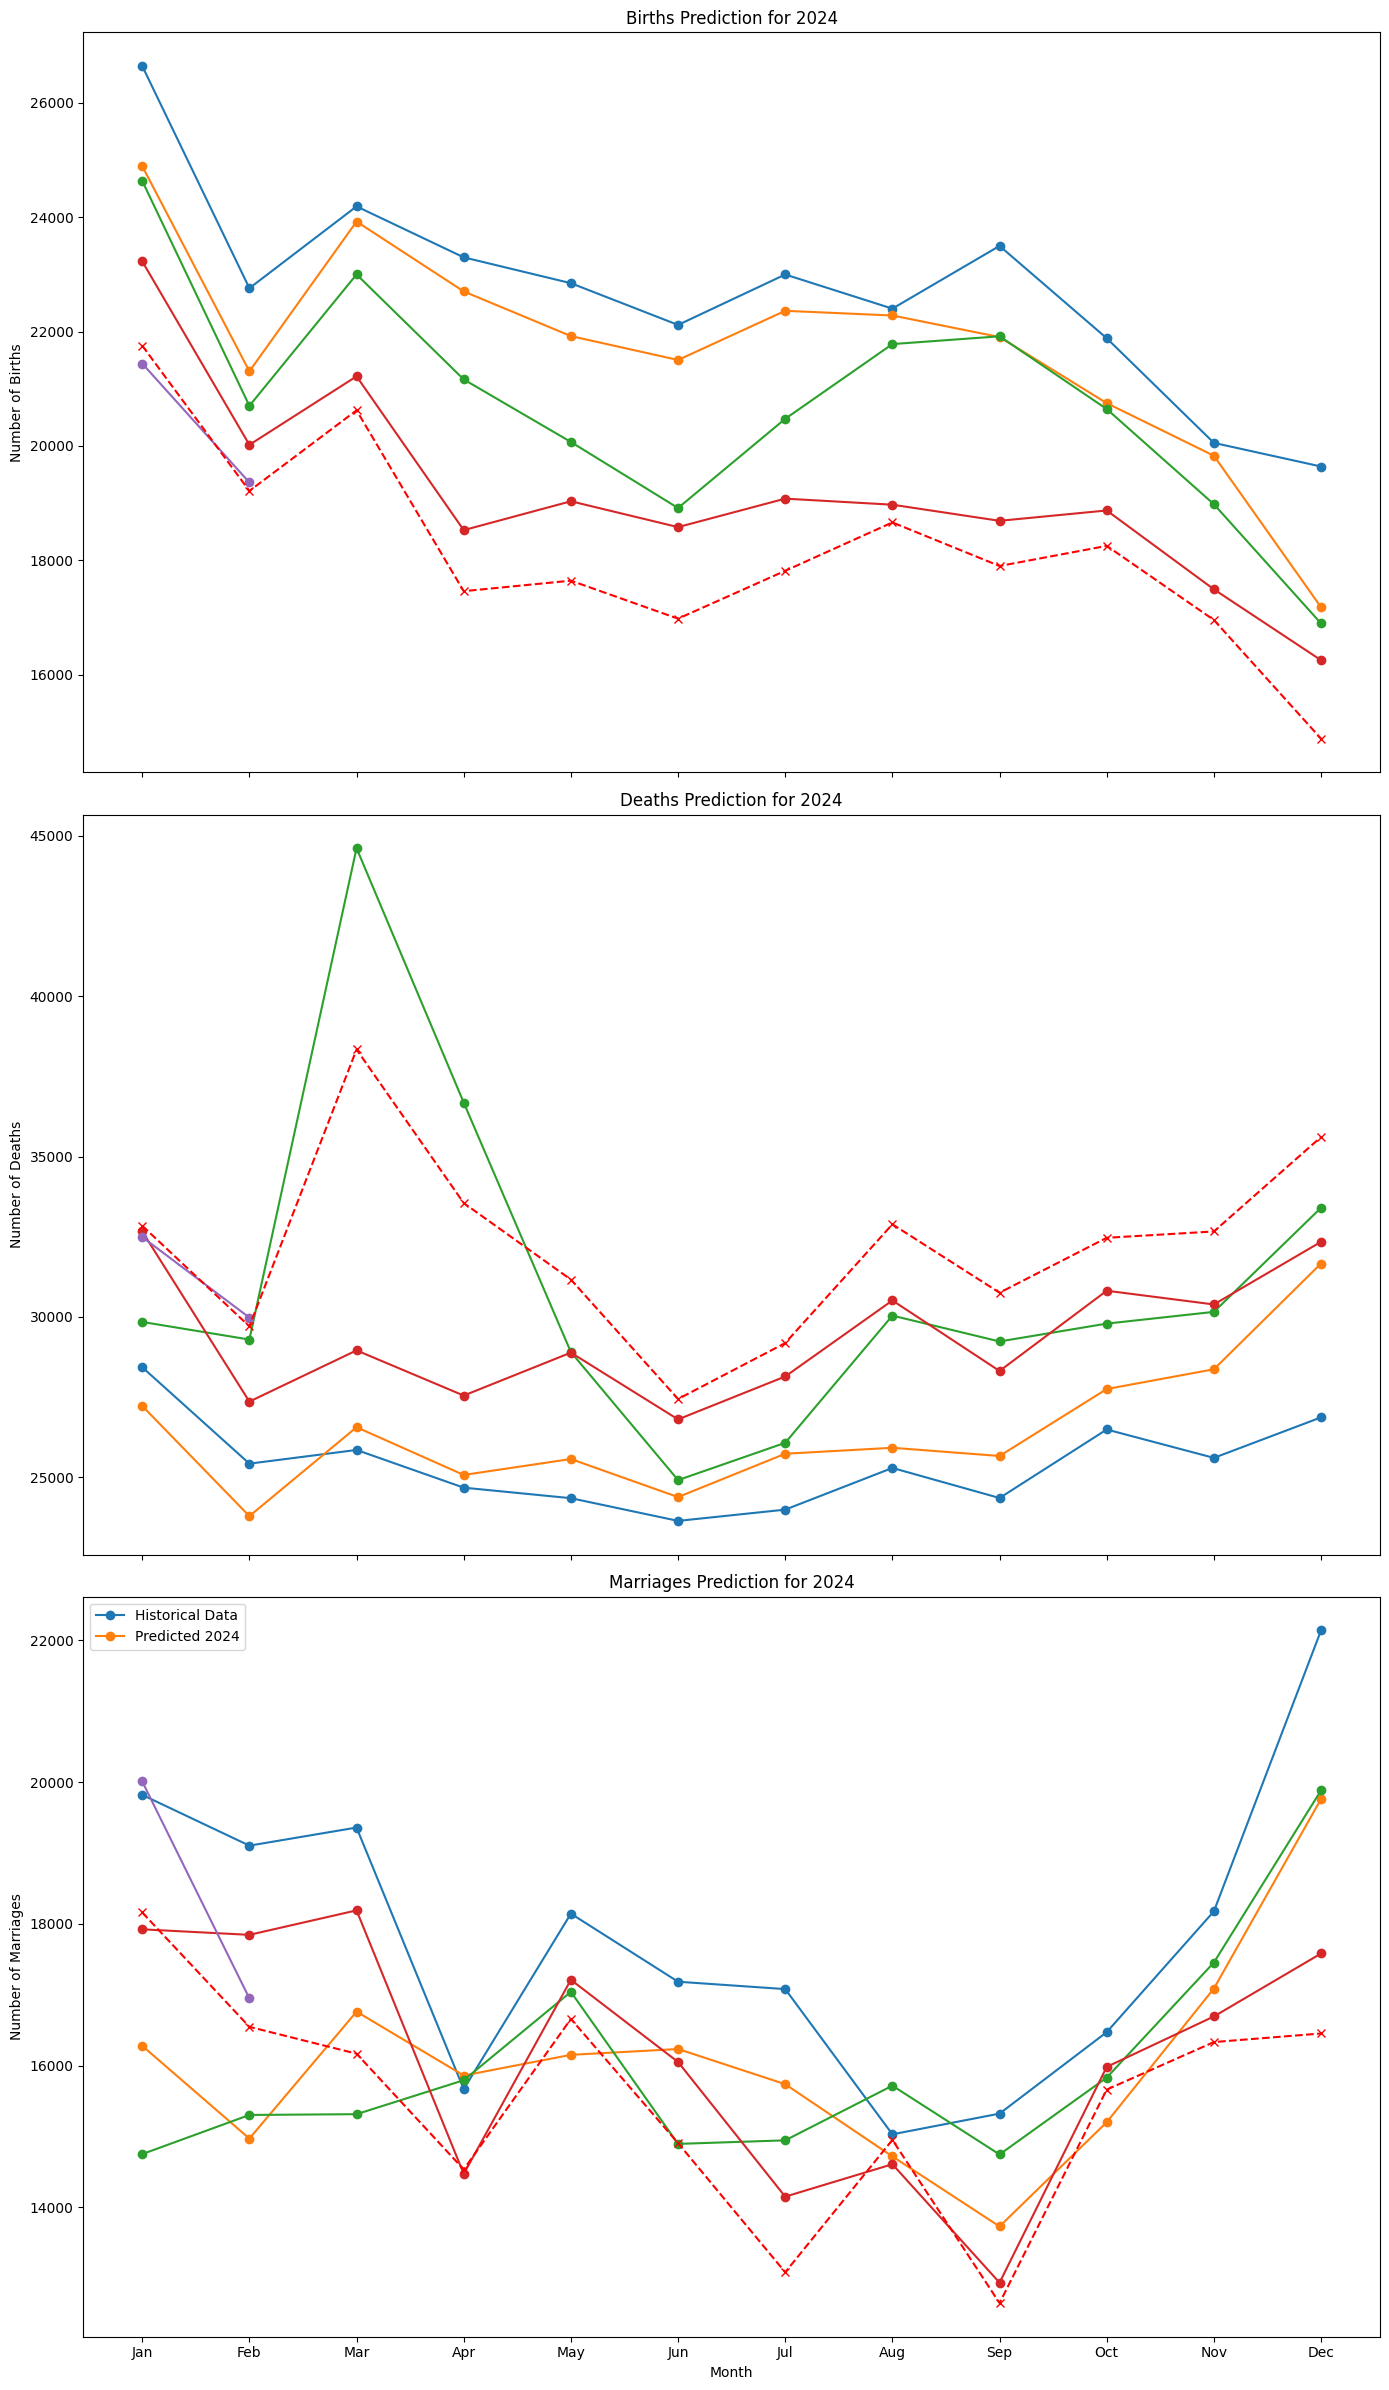
회귀 분석 결과 출생자 수는 점점 줄어들고 사망자 수는 점점 늘어나고 결혼 수도 감소하는 것으로 나오네요. 정부가 별다른 노력을 기하지 않는다면요.
'사회 > 저출산' 카테고리의 다른 글
| 2024년 1월 2월 인구 동향 (0) | 2024.04.29 |
|---|---|
| 저출산 문제는 고용보험에서 나가는 육아휴직급여 (0) | 2024.04.20 |
| 저출산 대책은 생산인구, 부양인구부터 (0) | 2024.04.12 |
| 외벌이 고소득 가구의 출산율은 높을까? (2) | 2024.03.23 |
| 2024년 합계출산율은 반등할까? (1) | 2024.03.15 |
'사회/저출산' Related Articles
more


